13-Week Treasury, BI & Demand Forecaster
RunwayIQ: 13-week probabilistic cash-flow and SKU stockout forecasting.
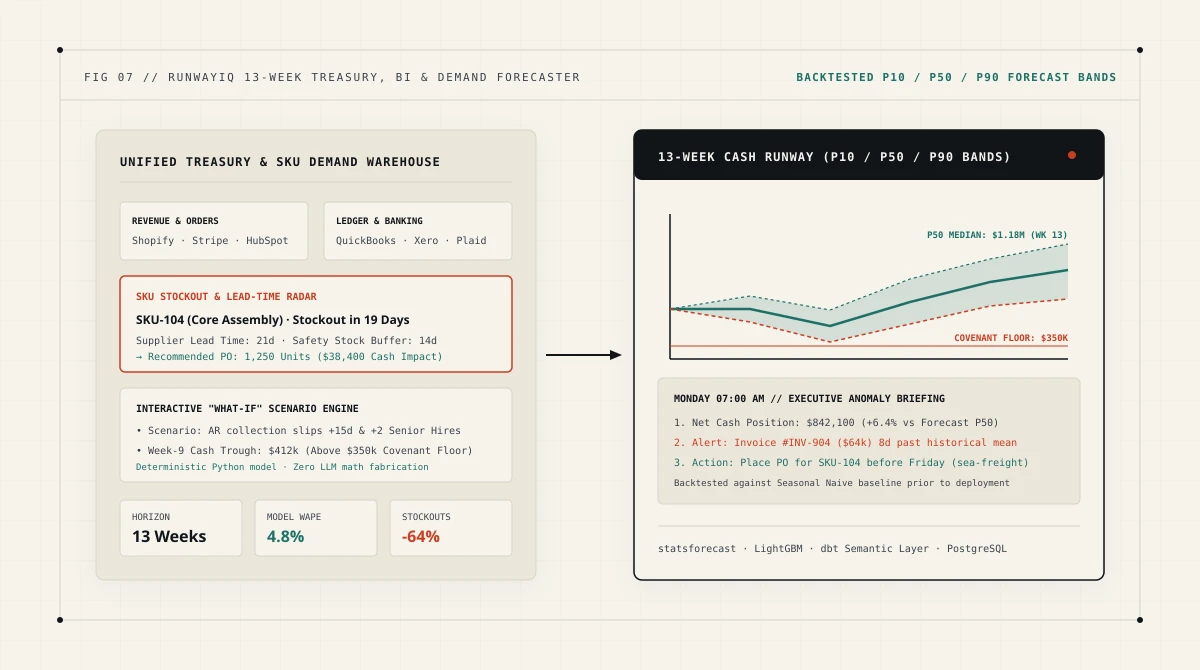
Consolidates accounting, commerce, and warehouse data to project rolling 13-week cash runway, flag inventory stockouts early, and simulate financial scenarios.
System Architecture Schematic
The Business Pain Point & Operational Requirements
Why off-the-shelf software breaks under this workflow.
Founders, COOs, and CFOs of growing companies rarely suffer from a lack of raw data—they suffer from data scattered across six SaaS silos. Revenue lives in Shopify or Stripe, bills and payroll live in QuickBooks or Xero, pipeline lives in HubSpot, and stock counts live in a WMS. By the time finance stitches together a monthly spreadsheet, the numbers are two weeks stale.
Worse, backward-looking dashboards only tell leadership what happened last month. They fail to warn when three large enterprise customers slow-pay their invoices at the exact same week a $120,000 inventory container deposit comes due—or when a top-selling SKU is 18 days from stocking out against a 21-day supplier lead time.
What the operation required
- 01Consolidate accounting, commerce, banking, CRM pipeline, and inventory data into one reconciled warehouse with automated daily schema and freshness checks.
- 02Project 13-week rolling cash inflows, outflows, and net runway with calibrated P10 / P50 / P90 confidence bands grounded in actual customer payment behavior.
- 03Forecast SKU-level demand against supplier lead times and safety stock buffers to flag stockout dates and exact cash required for purchase orders.
- 04Give leadership an interactive "What-If" simulator and a proactive Monday 7:00 AM executive briefing that highlights anomalies and required decisions.
In-Depth Features & Functional Modules
What the system does in production
Cross-stack ETL & reconciled executive warehouse
Automated connectors ingest and normalize transactions from Stripe, Shopify, QuickBooks/Xero, Plaid bank feeds, HubSpot, and ERP inventory tables into a single audited semantic layer.
13-week probabilistic cash-flow & AR collection engine
Models accounts receivable collection curves per customer cohort (factoring in historical days-to-pay drift) alongside scheduled payroll, debt covenants, tax obligations, and supplier payables.
Lead-time-aware SKU stockout & purchasing radar
Combines seasonal time-series forecasting with supplier lead times and minimum order quantities (MOQs) to output exact reorder dates, recommended PO quantities, and their net cash impact.
Interactive "What-If" simulator & Monday 7 AM briefing
Allows executives to stress-test hiring plans, ad spend shifts, or delayed receivables in real time, and delivers a weekly narrative briefing every Monday morning flagging margin compression, AR slippage, and urgent POs.
Technical Architecture
Four-stage production pipeline
Idempotent Cross-Stack ETL Connectors
Incremental sync workers pull normalized ledgers from accounting, commerce, banking, and inventory APIs with strict reconciliation checks.
Semantic Warehouse & Metric Layer
PostgreSQL + dbt models enforce single-source-of-truth definitions for Net Cash, Gross Margin, Contribution Margin, and Available-to-Promise Stock.
Backtested Quantitative Forecast Engine
Python statistical and gradient-boosted models (`statsforecast` + `LightGBM`) compute P10/P50/P90 cash and demand trajectories benchmarked against naive baselines.
Scenario Simulator & Narrative Dispatch
Deterministic simulation API powers the Next.js executive cockpit and generates grounded Monday morning briefings via Slack and email.
Engineering Complexity & Stack
Hard technical problems solved under the hood
Beating naive baselines on noisy, seasonal mid-market data
Built an automated rolling-origin backtesting harness that evaluates candidate time-series models (`AutoETS`, `AutoARIMA`, `LightGBM`) per SKU and cash stream against a Seasonal Naive baseline (`WAPE` / `MASE`), deploying complex models only where they provably reduce forecast error.
Separating deterministic financial math from narrative AI
All forecasts, covenant checks, and "What-If" cash simulations execute in pure, reproducible Python/SQL models; the LLM layer is used strictly to translate natural-language scenario parameters and summarize pre-computed variance tables.
Customer-specific AR payment drift modeling
Instead of assuming net-30 invoices arrive on day 30, engineered survival-curve payment estimators per customer tier so the 13-week cash trough reflects real-world collection timing.
Architectural Takeaways
Principles we carry into every custom deployment
Principle 01
A forecast without a backtested error metric against a naive baseline is just a guess; showing P10/P50/P90 confidence bands lets CFOs plan for the downside without freezing growth.
Principle 02
Connecting inventory reorder triggers directly to the 13-week cash model prevents operations from placing a purchase order that blindsides treasury.
Explore More Case Studies
Other systems we have architected
Okebase
Multi-Entity ERP & Operations LedgerUnifies inventory, purchasing, approvals, and consolidated accounting across subsidiaries with database-enforced tenant isolation and sub-50ms ledger queries.
VoxFlow
Autonomous Voice & Lead Dispatch EngineAnswers every inbound call on the first ring, dials new web leads within 45 seconds, locks live calendar slots, and syncs the CRM.
AdVantage
Omnichannel AI Sales & Campaign EngineUnifies WhatsApp, Instagram, and Messenger with a catalog-grounded AI sales representative and closed-loop Meta campaign automation.
Opsera
Slack-Native Company Operations OSRuns daily standups, leave approvals, RBAC task tracking, and AI thread-to-task structuring in Slack, synced with an executive web cockpit.
SyncDaily
Personalized AI Intelligence PlatformIngests and deduplicates global AI research, model releases, and market moves into tailored impact briefings for leaders, engineers, and students.
LedgerFlow
Autonomous AP & 3-Way Match PipelineExtracts multi-page vendor PDFs with deterministic math checks, reconciles lines against purchase orders and receipts, and posts clean vouchers to the ERP.
VaultRAG
Permission-Scoped Knowledge & Data EngineDeduplicates messy CRM records and answers operational questions across internal SOPs, contracts, and databases with role-level access controls and exact page citations.
Dealing with a similar operational bottleneck?
We architect, customize, and deploy systems like this tailored to your workflow and contract structure—or start with a free 2–4 page written systems review.